> PVE 原生支持 Graphite 或者 InfluxDB 作为指标数据的存储,这俩我还没折腾过,本文主要围绕着prometheus-pve-exporter来写,类似于node_exporter 这里就不再多说了。 > ### 安装 proxmox-pve-exporter [card title="说明" color="warning"] 这里我将 proxmox-pve-exporter 安装到单独的服务器,而不是 pve宿主机,,这样可以通过一个 exporter 去监控多台 pve 主机,如果只有一台机器的话直接在pve主机安装就行。。。 [/card] GitHub地址:https://github.com/prometheus-pve/prometheus-pve-exporter 安装 exporter,如果没有pip3的话需要先安装`python3-pip` ```bash pip3 install prometheus-pve-exporter -i https://mirrors.tuna.tsinghua.edu.cn/pypi/web/simple ``` 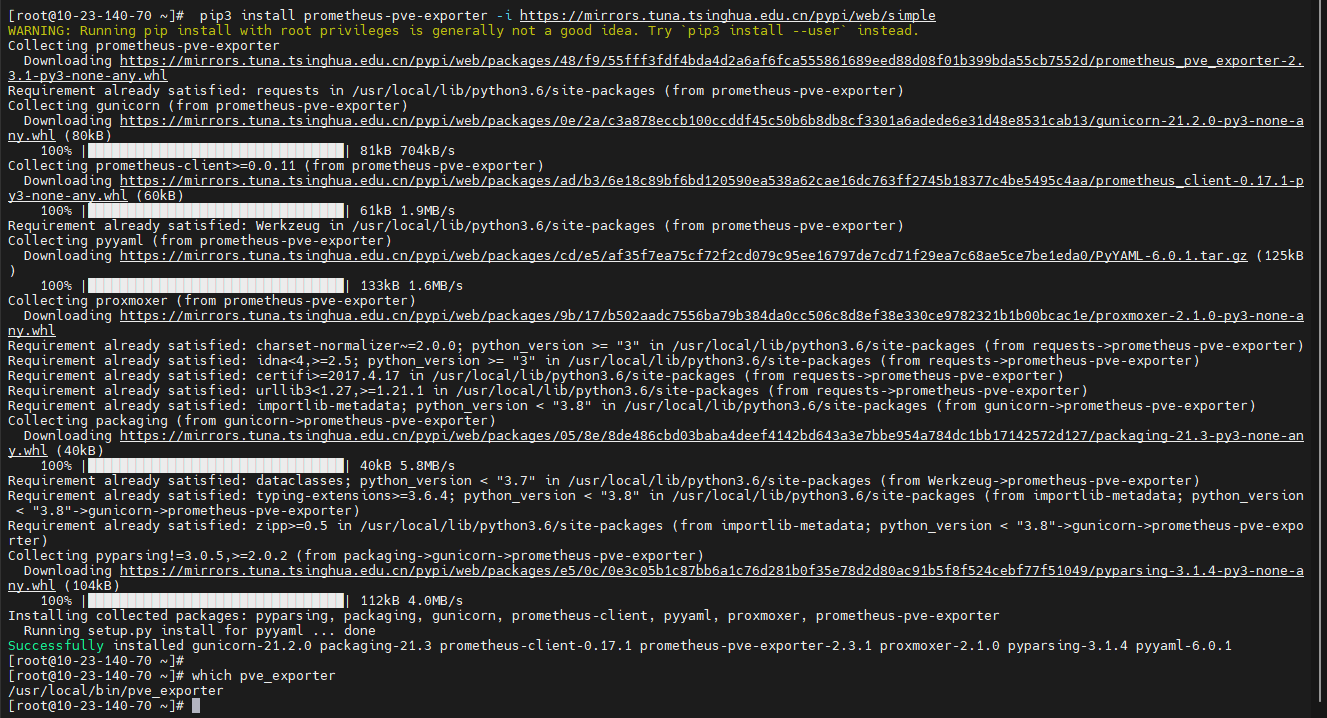 安装完成后可以通过 `pve_exporter -h` 查看帮助信息 帮助命令机翻: ```bash 用法:pve_exporter [-h] [--collector.status | --no-collector.status] [--收集器.版本 | --无收集器.版本] [--收集器.节点|--无收集器.节点] [--收集器.集群|--no-收集器.集群] [--收集器.资源|--无收集器.资源] [--收集器.配置|--无收集器.配置] [--收集器.复制|--no-收集器.复制] [--config.文件 CONFIG_FILE] [--web.listen 地址 WEB_LISTEN_ADDRESS] [--server.keyfile 服务器密钥文件] [--server.certfile 服务器证书文件] 选项: -h, --help 显示此帮助消息并退出 --config.file 配置文件 配置文件路径(/etc/prometheus/pve.yml) –web.listen 地址 WEB_LISTEN_ADDRESS 公开指标和 Web 服务器的地址。 ([::]:9221) --server.keyfile 服务器密钥文件 服务器的 SSL 密钥 --server.certfile 服务器证书文件 服务器的 SSL 证书 集群收集器: 如果设置了 URL 参数 cluster=1,则运行集群收集器,并且 如果在抓取 URL 上设置了 url 参数 cluster=0,则跳过。 --collector.status,--no-collector.status 公开节点/VM/CT 状态 --collector.version,--无收集器.版本 公开 PVE 版本信息 --collector.node,--no-collector.node 公开 PVE 节点信息 --collector.cluster,--no-collector.cluster 公开 PVE 集群信息 --collector.resources,--no-collector.resources 公开 PVE 资源信息 节点收集器: 如果设置了 url 参数 node=1,则运行节点收集器;如果设置了 url 参数 node=1,则跳过节点收集器 在抓取 URL 上设置了 URL 参数 node=0。 --collector.config,--no-collector.config 公开 PVE 启动状态 --collector.replication,--no-collector.replication 公开 PVE 复制信息 ``` 也可以通过 Docker 安装 ```bash docker run --init --name prometheus-pve-exporter -d -p 127.0.0.1:9221:9221 -v /path/to/pve.yml:/etc/prometheus/pve.yml prompve/prometheus-pve-exporter ``` ### 配置监控用户 出于安全原因,必须添加具有只读访问权限的用户(PVEAuditor 角色)来收集指标。 在所有的PVE主机创建一个用户 ```bash pveum useradd monitor@pve -comment "monitor for exporter" # 创建用户 pveum passwd monitor@pve # 配置密码 ``` 为 prometheus 用户分配 PVEAuditor 监控角色的权限 ```bash pveum aclmod / -user monitor@pve -role PVEAuditor ``` ### 配置 proxmox-pve-exporter 在安装了 proxmox-pve-exporter 的主机中创建一个配置文件,用于定义PVE主机的用户名,密码,就是上面创建的用户 `nano /etc/prometheus/pve.yml` ```yaml default: user: monitor@pve password: your_password verify_ssl: false ``` 配置开机自启 ```bash tee /etc/systemd/system/prometheus-pve-exporter.service<<EOF [Unit] Description=Prometheus exporter for Proxmox VE Documentation=https://github.com/znerol/prometheus-pve-exporter [Service] Restart=always ExecStart=/usr/local/bin/pve_exporter /etc/prometheus/pve.yml [Install] WantedBy=multi-user.target EOF ``` ```bash systemctl daemon-reload && systemctl enable --now prometheus-pve-exporter.service ``` 默认端口 9221 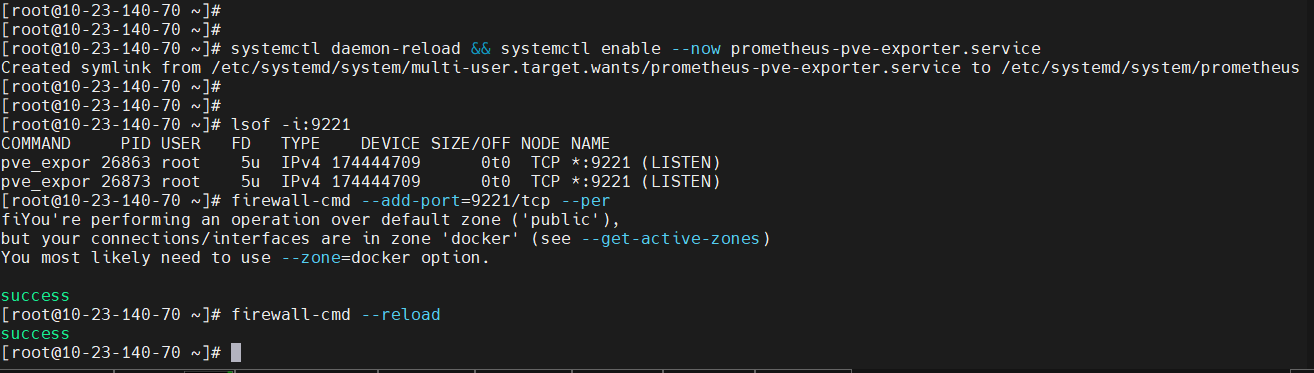 访问 exporter http://ip:9221 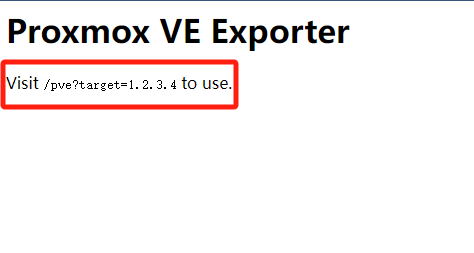 这里会让你访问`/pve?target=1.2.3.4`,其中 `target=` 是你的PVE主机IP地址,如果是在pve主机搭建的 prometheus-pve-exporter ip填 127.0.0.1 即可,我这种方法适合需要监控多台PVE主机的场景 查看监控指标 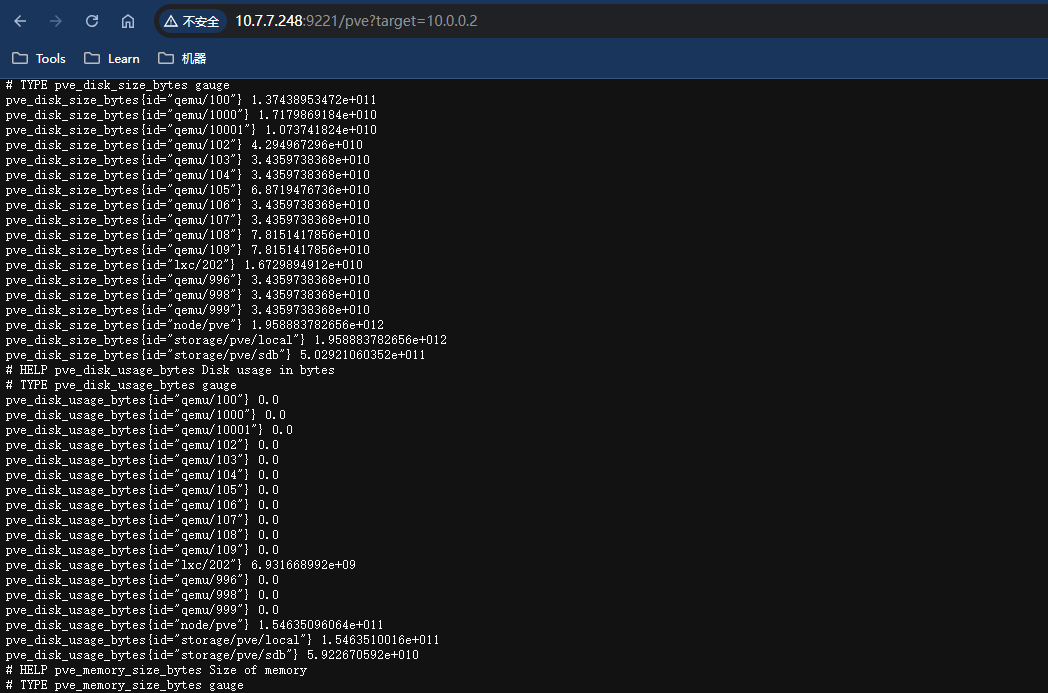 ### Prometheus 配置 单台机器 ```yaml - job_name: 'pve' metrics_path: /pve static_configs: - targets: ['127.0.0.1:9221'] # 如果是使用docker安装的话建议直接写pve主机的ip而不是环回地址 ``` 多台机器,使用`relabel_configs`重写目标地址 ```yaml - job_name: 'pve' static_configs: - targets: - 10.0.0.2 # pve node 1 - 10.0.0.3 # pve node 2 metrics_path: /pve params: module: [default] cluster: ['1'] node: ['1'] relabel_configs: - source_labels: [__address__] target_label: __param_target - source_labels: [__param_target] target_label: instance - target_label: __address__ replacement: 127.0.0.1:9221 # pve exporter ``` 配置完成后重启普罗米修斯,并进行验证 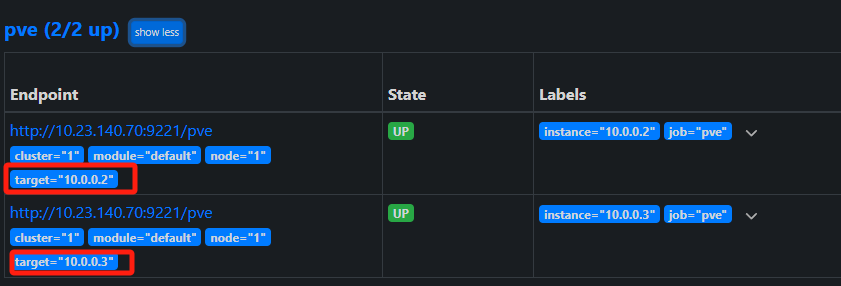 ### 配置Grafana仪表盘 这里推荐使用 10347 https://grafana.com/grafana/dashboards/10347-proxmox-via-prometheus/ 通过/dashboard/import 导入即可 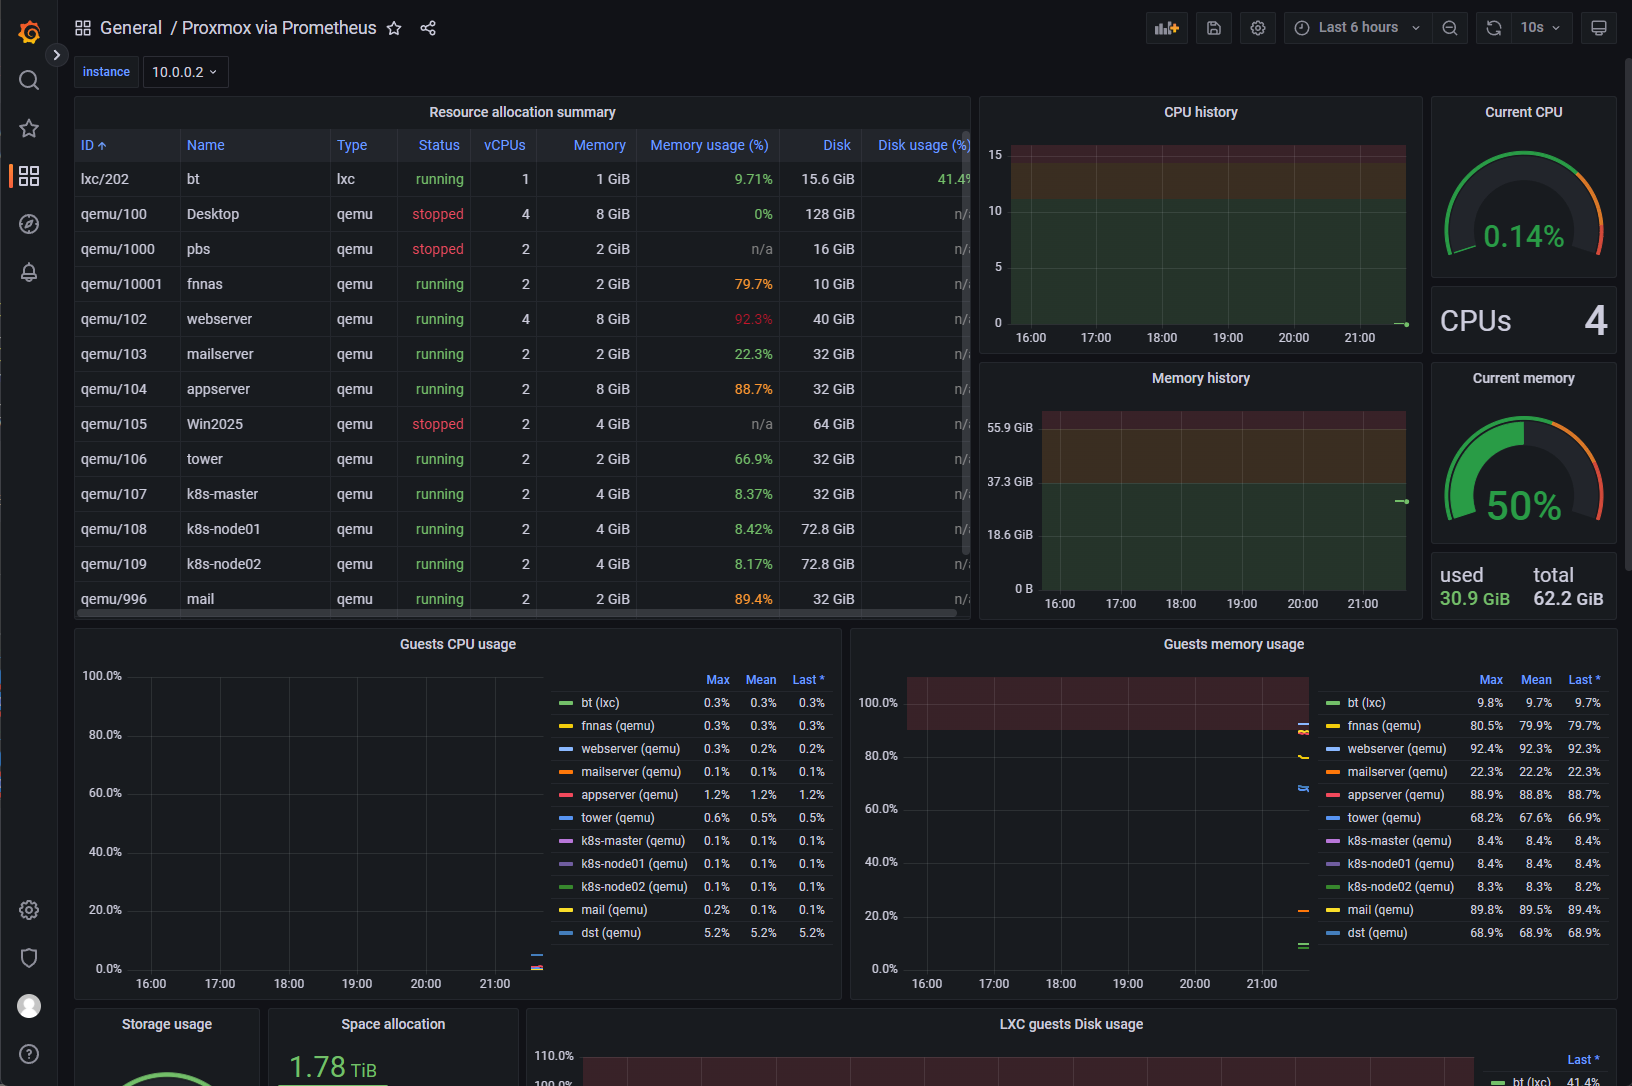 演示地址:https://grafana.wanghaoyu.com.cn/d/Dp7Cd57Zza/proxmox-via-prometheus Loading... > PVE 原生支持 Graphite 或者 InfluxDB 作为指标数据的存储,这俩我还没折腾过,本文主要围绕着prometheus-pve-exporter来写,类似于node_exporter 这里就不再多说了。 > ### 安装 proxmox-pve-exporter [card title="说明" color="warning"] 这里我将 proxmox-pve-exporter 安装到单独的服务器,而不是 pve宿主机,,这样可以通过一个 exporter 去监控多台 pve 主机,如果只有一台机器的话直接在pve主机安装就行。。。 [/card] GitHub地址:https://github.com/prometheus-pve/prometheus-pve-exporter 安装 exporter,如果没有pip3的话需要先安装`python3-pip` ```bash pip3 install prometheus-pve-exporter -i https://mirrors.tuna.tsinghua.edu.cn/pypi/web/simple ```  安装完成后可以通过 `pve_exporter -h` 查看帮助信息 帮助命令机翻: ```bash 用法:pve_exporter [-h] [--collector.status | --no-collector.status] [--收集器.版本 | --无收集器.版本] [--收集器.节点|--无收集器.节点] [--收集器.集群|--no-收集器.集群] [--收集器.资源|--无收集器.资源] [--收集器.配置|--无收集器.配置] [--收集器.复制|--no-收集器.复制] [--config.文件 CONFIG_FILE] [--web.listen 地址 WEB_LISTEN_ADDRESS] [--server.keyfile 服务器密钥文件] [--server.certfile 服务器证书文件] 选项: -h, --help 显示此帮助消息并退出 --config.file 配置文件 配置文件路径(/etc/prometheus/pve.yml) –web.listen 地址 WEB_LISTEN_ADDRESS 公开指标和 Web 服务器的地址。 ([::]:9221) --server.keyfile 服务器密钥文件 服务器的 SSL 密钥 --server.certfile 服务器证书文件 服务器的 SSL 证书 集群收集器: 如果设置了 URL 参数 cluster=1,则运行集群收集器,并且 如果在抓取 URL 上设置了 url 参数 cluster=0,则跳过。 --collector.status,--no-collector.status 公开节点/VM/CT 状态 --collector.version,--无收集器.版本 公开 PVE 版本信息 --collector.node,--no-collector.node 公开 PVE 节点信息 --collector.cluster,--no-collector.cluster 公开 PVE 集群信息 --collector.resources,--no-collector.resources 公开 PVE 资源信息 节点收集器: 如果设置了 url 参数 node=1,则运行节点收集器;如果设置了 url 参数 node=1,则跳过节点收集器 在抓取 URL 上设置了 URL 参数 node=0。 --collector.config,--no-collector.config 公开 PVE 启动状态 --collector.replication,--no-collector.replication 公开 PVE 复制信息 ``` 也可以通过 Docker 安装 ```bash docker run --init --name prometheus-pve-exporter -d -p 127.0.0.1:9221:9221 -v /path/to/pve.yml:/etc/prometheus/pve.yml prompve/prometheus-pve-exporter ``` ### 配置监控用户 出于安全原因,必须添加具有只读访问权限的用户(PVEAuditor 角色)来收集指标。 在所有的PVE主机创建一个用户 ```bash pveum useradd monitor@pve -comment "monitor for exporter" # 创建用户 pveum passwd monitor@pve # 配置密码 ``` 为 prometheus 用户分配 PVEAuditor 监控角色的权限 ```bash pveum aclmod / -user monitor@pve -role PVEAuditor ``` ### 配置 proxmox-pve-exporter 在安装了 proxmox-pve-exporter 的主机中创建一个配置文件,用于定义PVE主机的用户名,密码,就是上面创建的用户 `nano /etc/prometheus/pve.yml` ```yaml default: user: monitor@pve password: your_password verify_ssl: false ``` 配置开机自启 ```bash tee /etc/systemd/system/prometheus-pve-exporter.service<<EOF [Unit] Description=Prometheus exporter for Proxmox VE Documentation=https://github.com/znerol/prometheus-pve-exporter [Service] Restart=always ExecStart=/usr/local/bin/pve_exporter /etc/prometheus/pve.yml [Install] WantedBy=multi-user.target EOF ``` ```bash systemctl daemon-reload && systemctl enable --now prometheus-pve-exporter.service ``` 默认端口 9221  访问 exporter http://ip:9221  这里会让你访问`/pve?target=1.2.3.4`,其中 `target=` 是你的PVE主机IP地址,如果是在pve主机搭建的 prometheus-pve-exporter ip填 127.0.0.1 即可,我这种方法适合需要监控多台PVE主机的场景 查看监控指标  ### Prometheus 配置 单台机器 ```yaml - job_name: 'pve' metrics_path: /pve static_configs: - targets: ['127.0.0.1:9221'] # 如果是使用docker安装的话建议直接写pve主机的ip而不是环回地址 ``` 多台机器,使用`relabel_configs`重写目标地址 ```yaml - job_name: 'pve' static_configs: - targets: - 10.0.0.2 # pve node 1 - 10.0.0.3 # pve node 2 metrics_path: /pve params: module: [default] cluster: ['1'] node: ['1'] relabel_configs: - source_labels: [__address__] target_label: __param_target - source_labels: [__param_target] target_label: instance - target_label: __address__ replacement: 127.0.0.1:9221 # pve exporter ``` 配置完成后重启普罗米修斯,并进行验证  ### 配置Grafana仪表盘 这里推荐使用 10347 https://grafana.com/grafana/dashboards/10347-proxmox-via-prometheus/ 通过/dashboard/import 导入即可  演示地址:https://grafana.wanghaoyu.com.cn/d/Dp7Cd57Zza/proxmox-via-prometheus Last modification:April 25, 2025 © Allow specification reprint Support Appreciate the author Like 如果觉得我的文章对你有用,请随意赞赏